Additional Figures
Leah Crenshaw | October 2nd, 2024 | Estes Park, Colorado
Here I’d like to share some of the original, full size figures included in the poster as well as some figures I produced during my analysis.
Transect Count Analysis
Using the transect count data, I analyzed both the abundance and
richness of both resident and migratory birds encountered across the 6
possible treatment conditions (High Landscape Forest Cover:
Sun-coffee, Shade-coffee, Forest
| Low Landscape Forest Cover: Sun-coffee,
Shade-coffee, Forest).
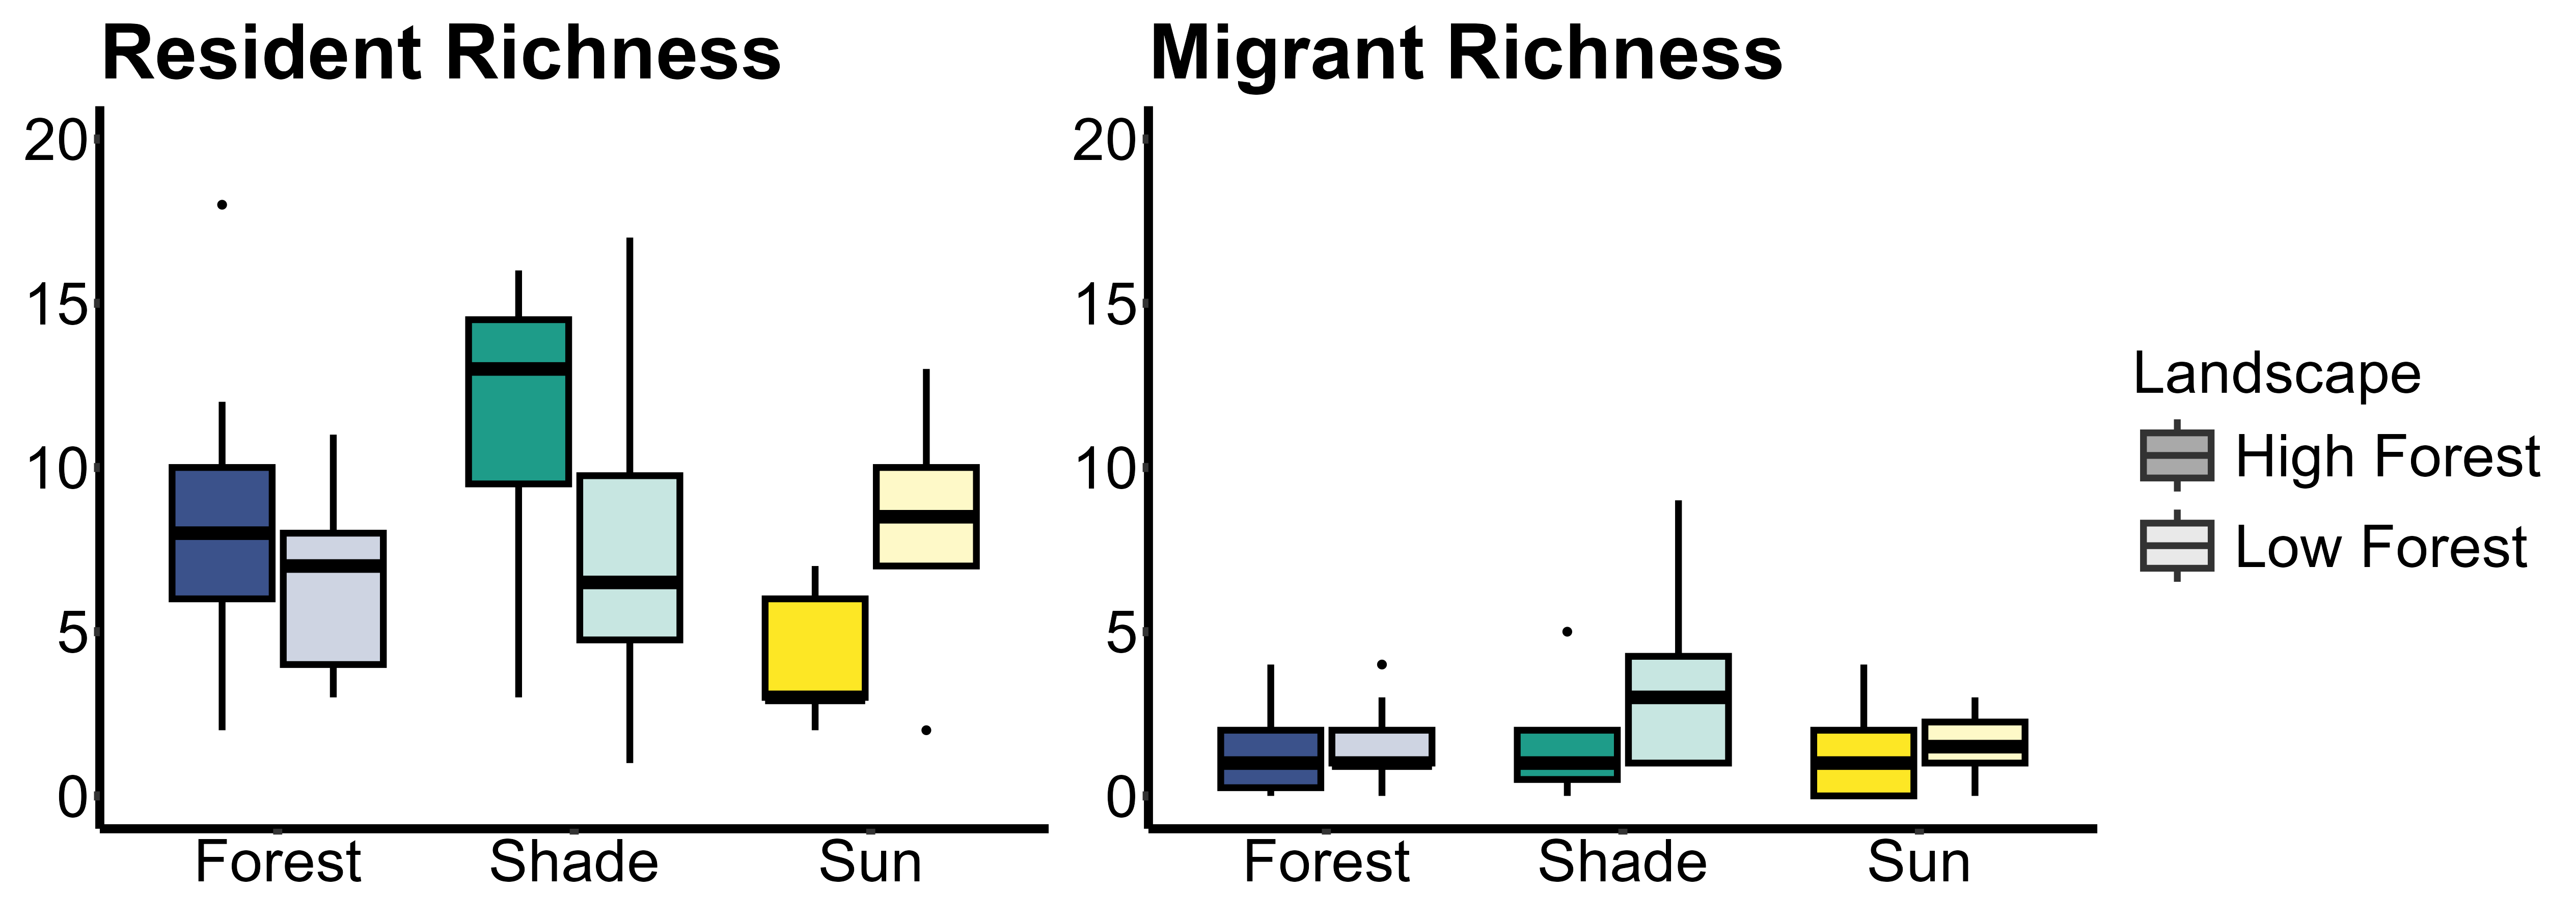
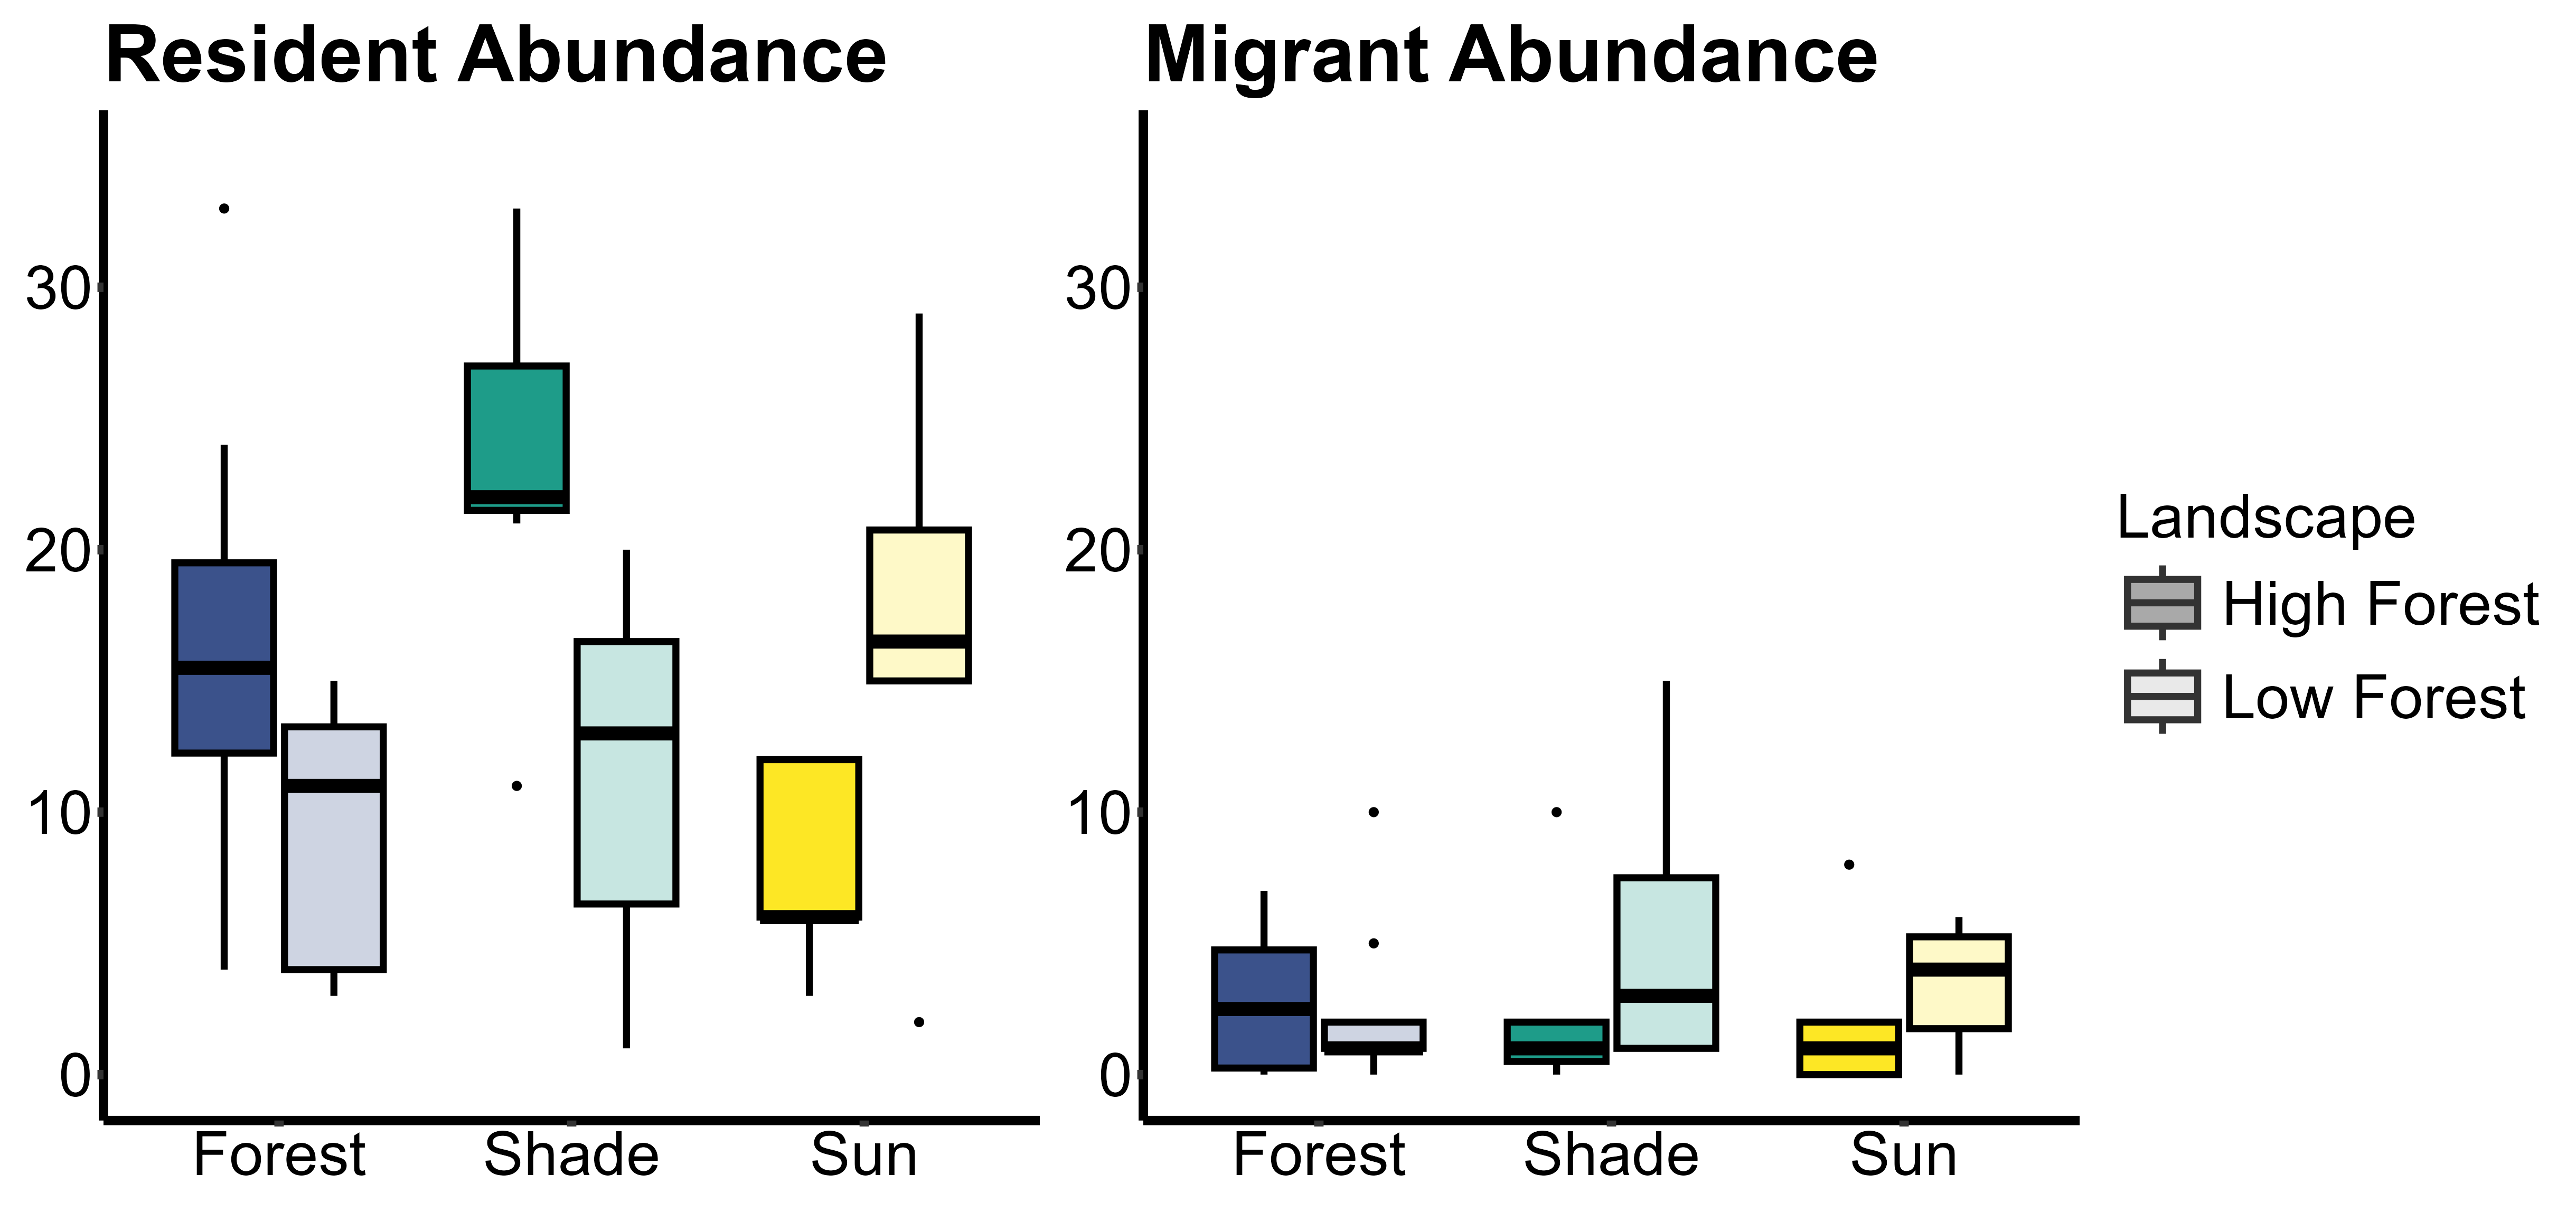
This figure is presented on the poster. We found that the species
richness of residents (p=0.04), but not migrants
(p=0.14), was affected by a
landscape*local interaction. Resident richness was
marginally affected by local land use
(p=0.09). The same pattern was evident for abundance of
residents (p=0.07), not migrants (p=0.43),
presented below.
Species Encountered and Habitat Associations
Below is the list of the 20 mostly commonly encountered species. On the left, you can see the total count observed, and on the right, you can see the distribution of habitats within which those species were observed.
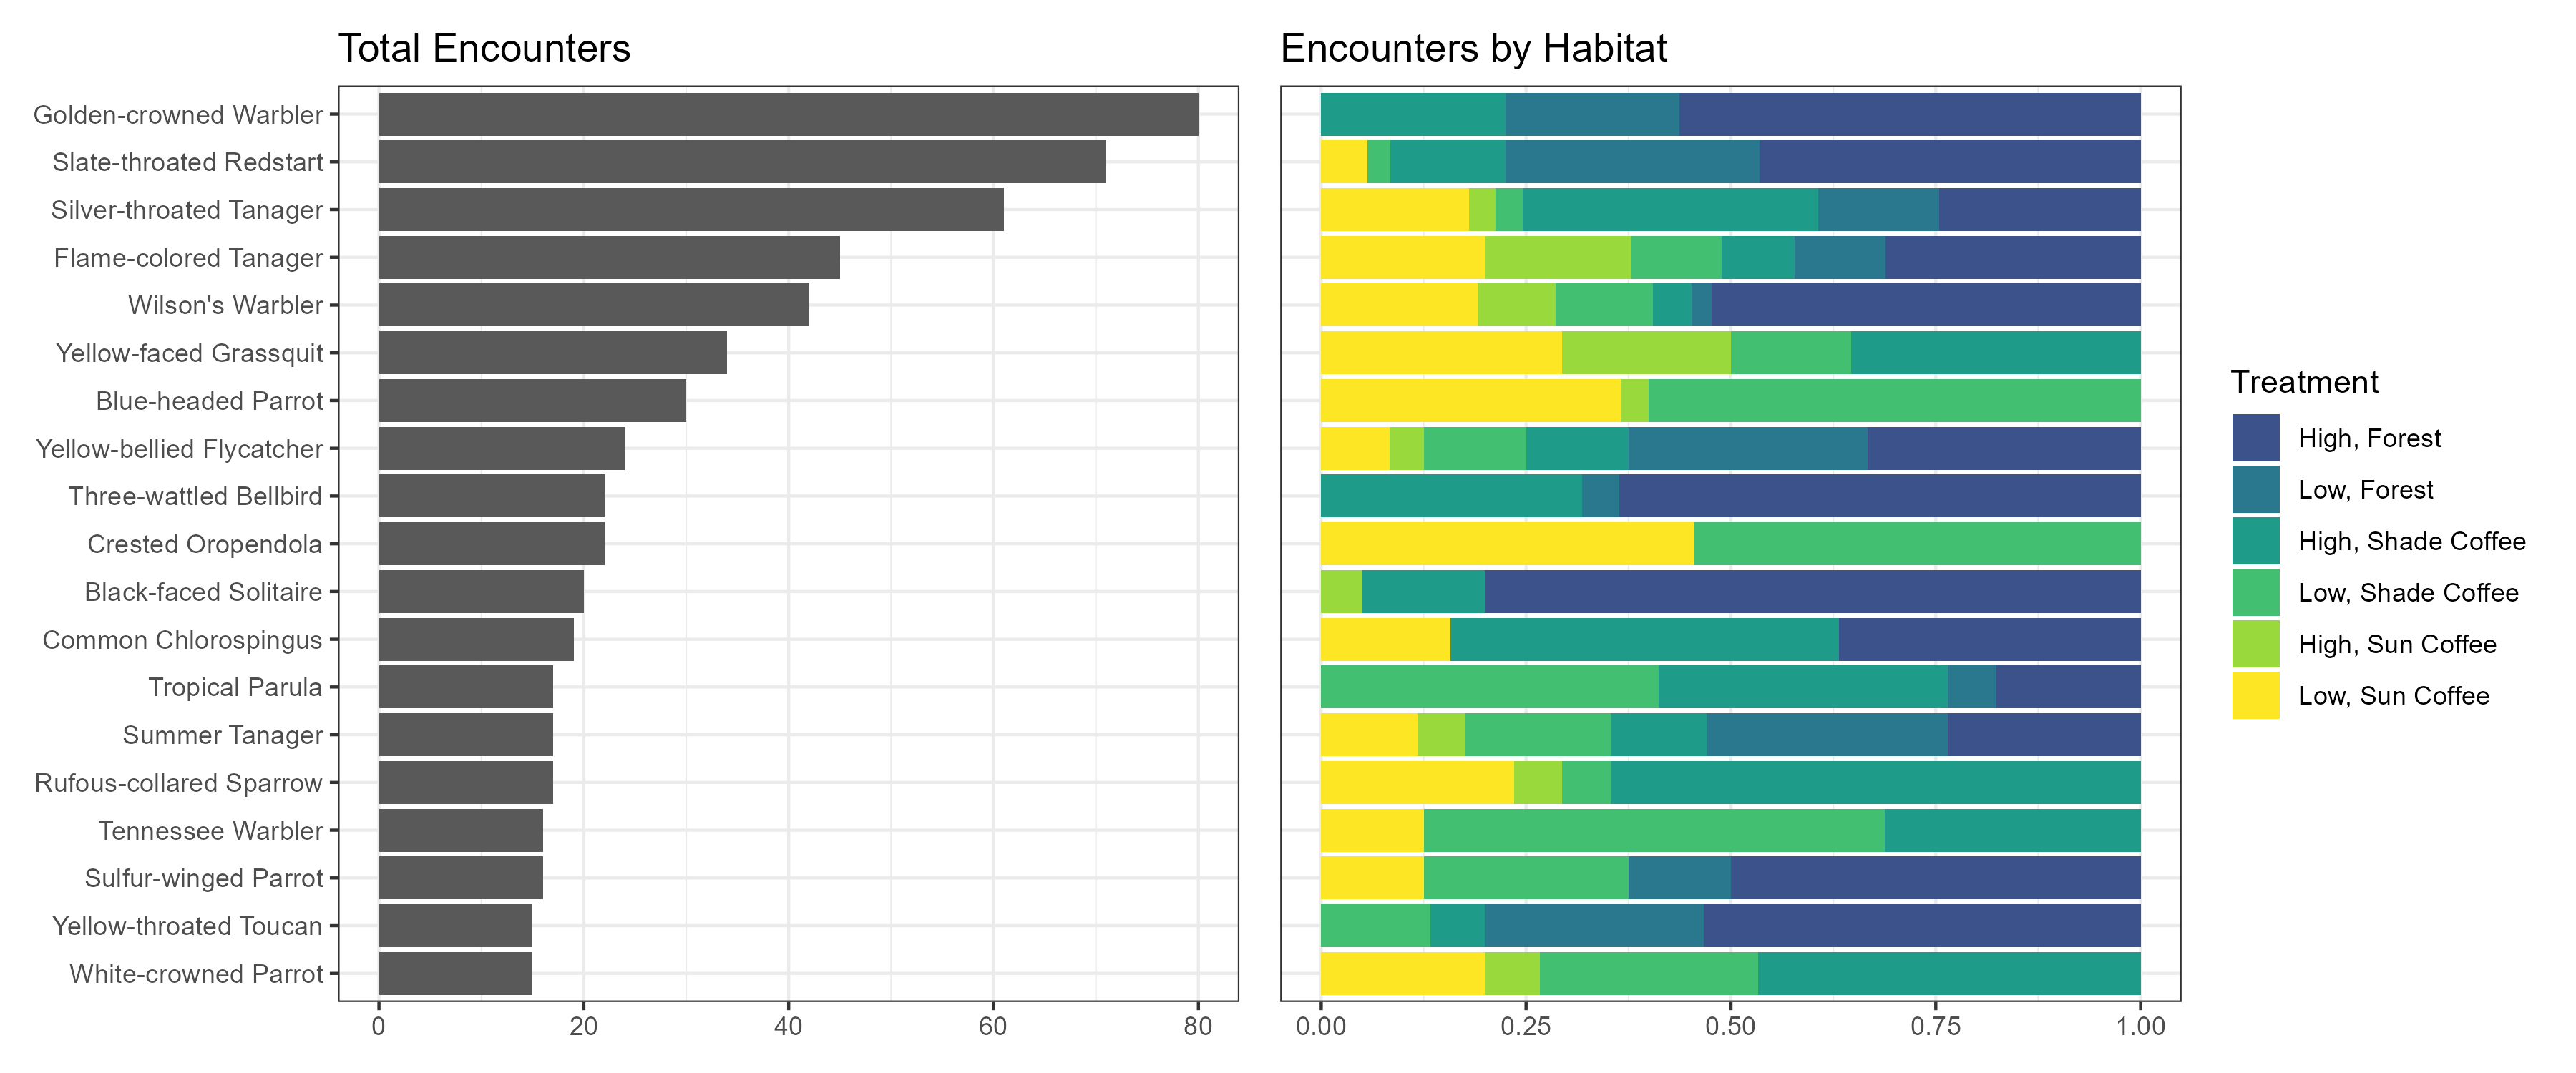
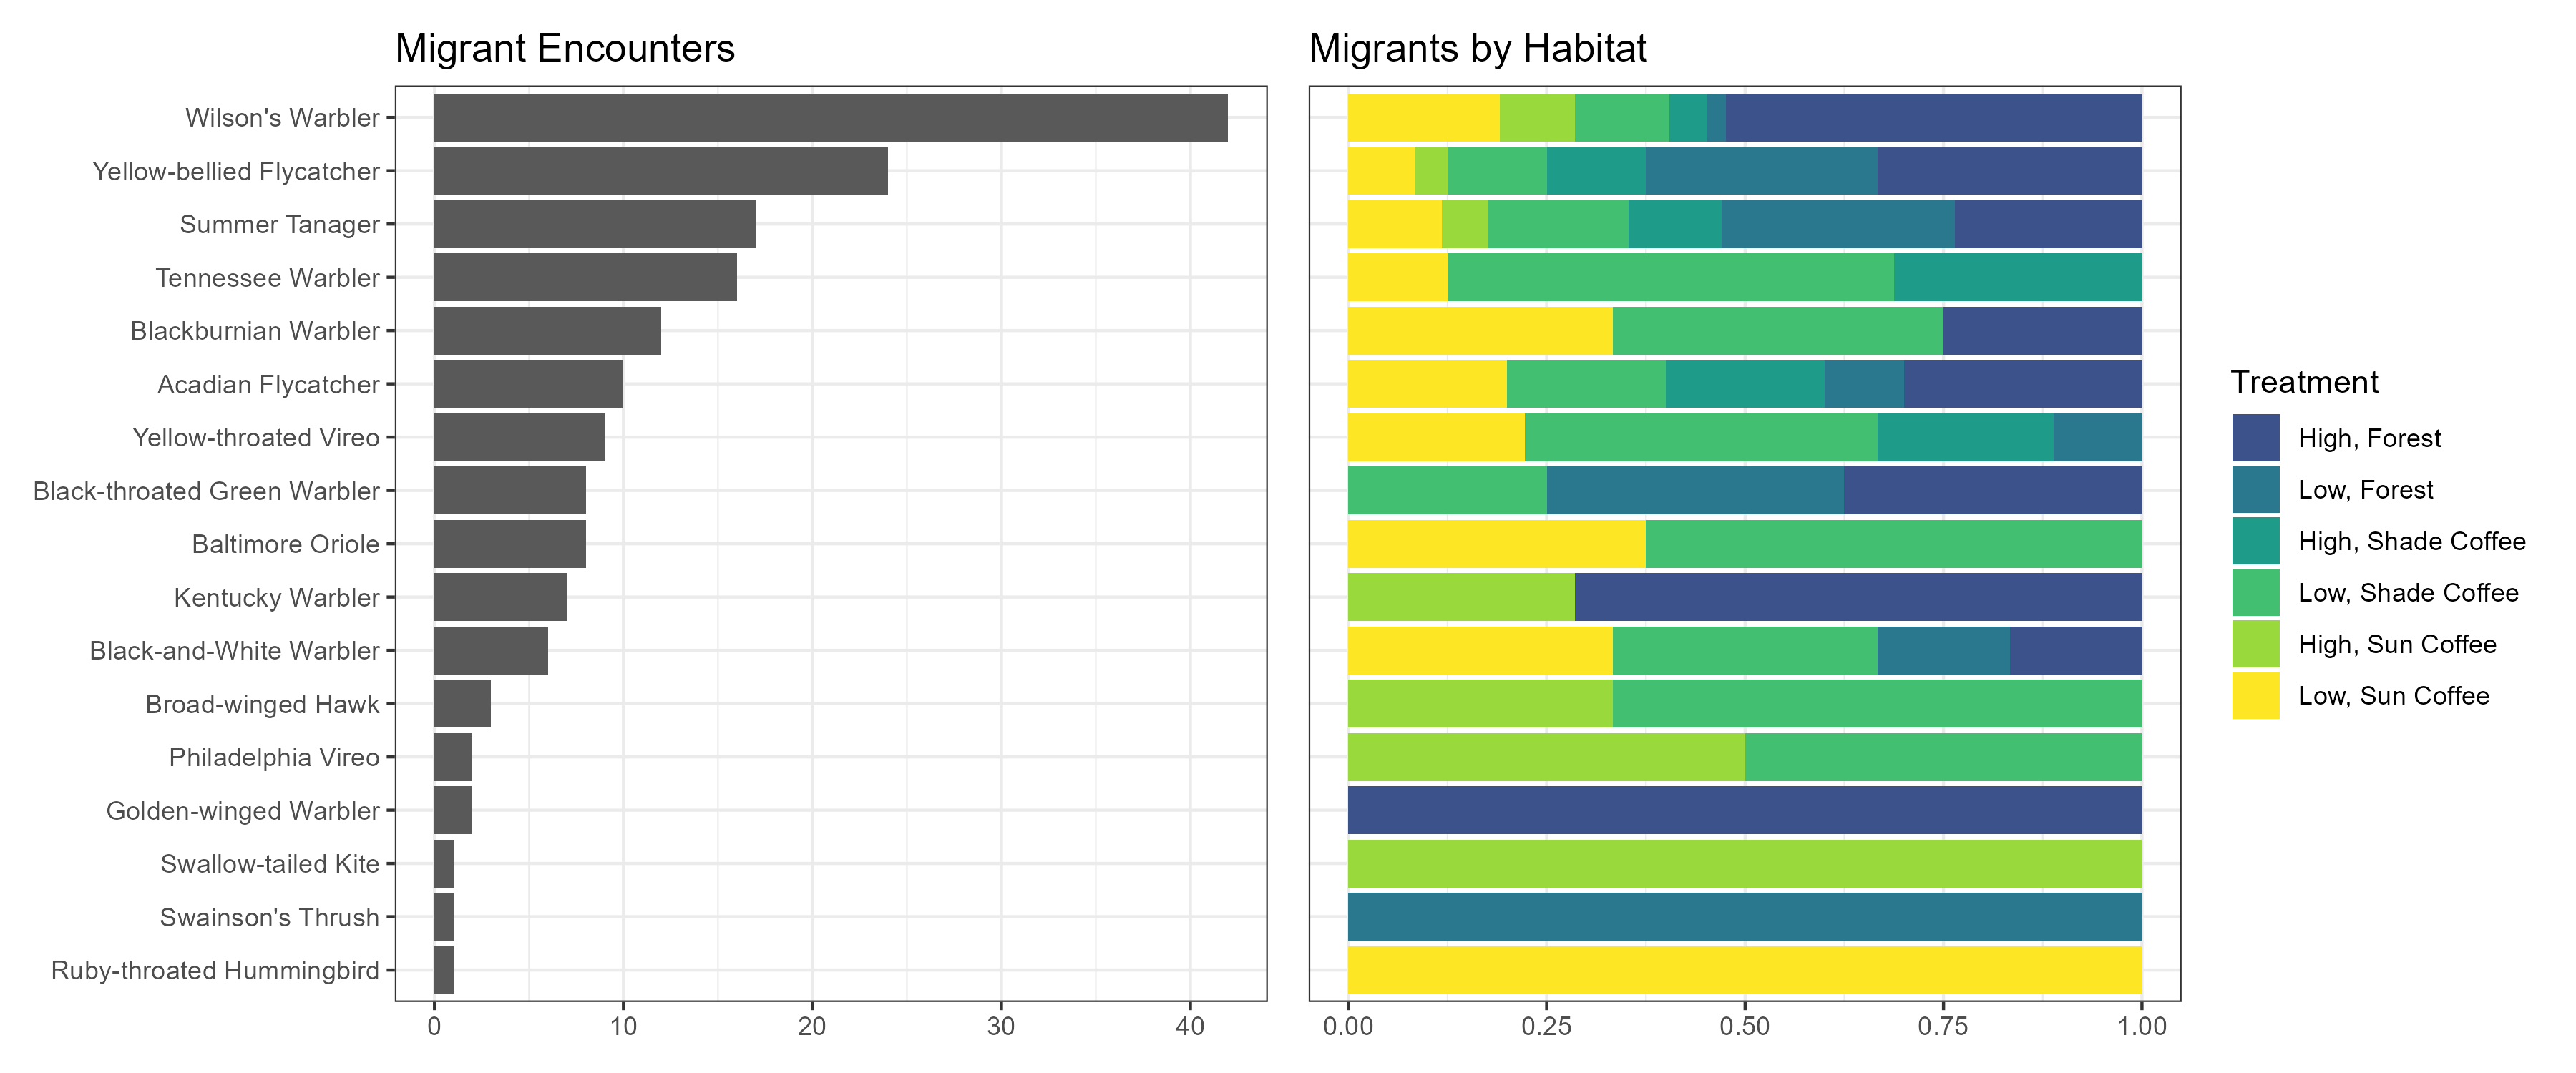
Across all sites, we found more resident individuals than migratory individuals. So, we also pulled the encounter data for all migratory species encountered across all transect surveys. Please note the reduced x-axis scale.
Flocking Behavior
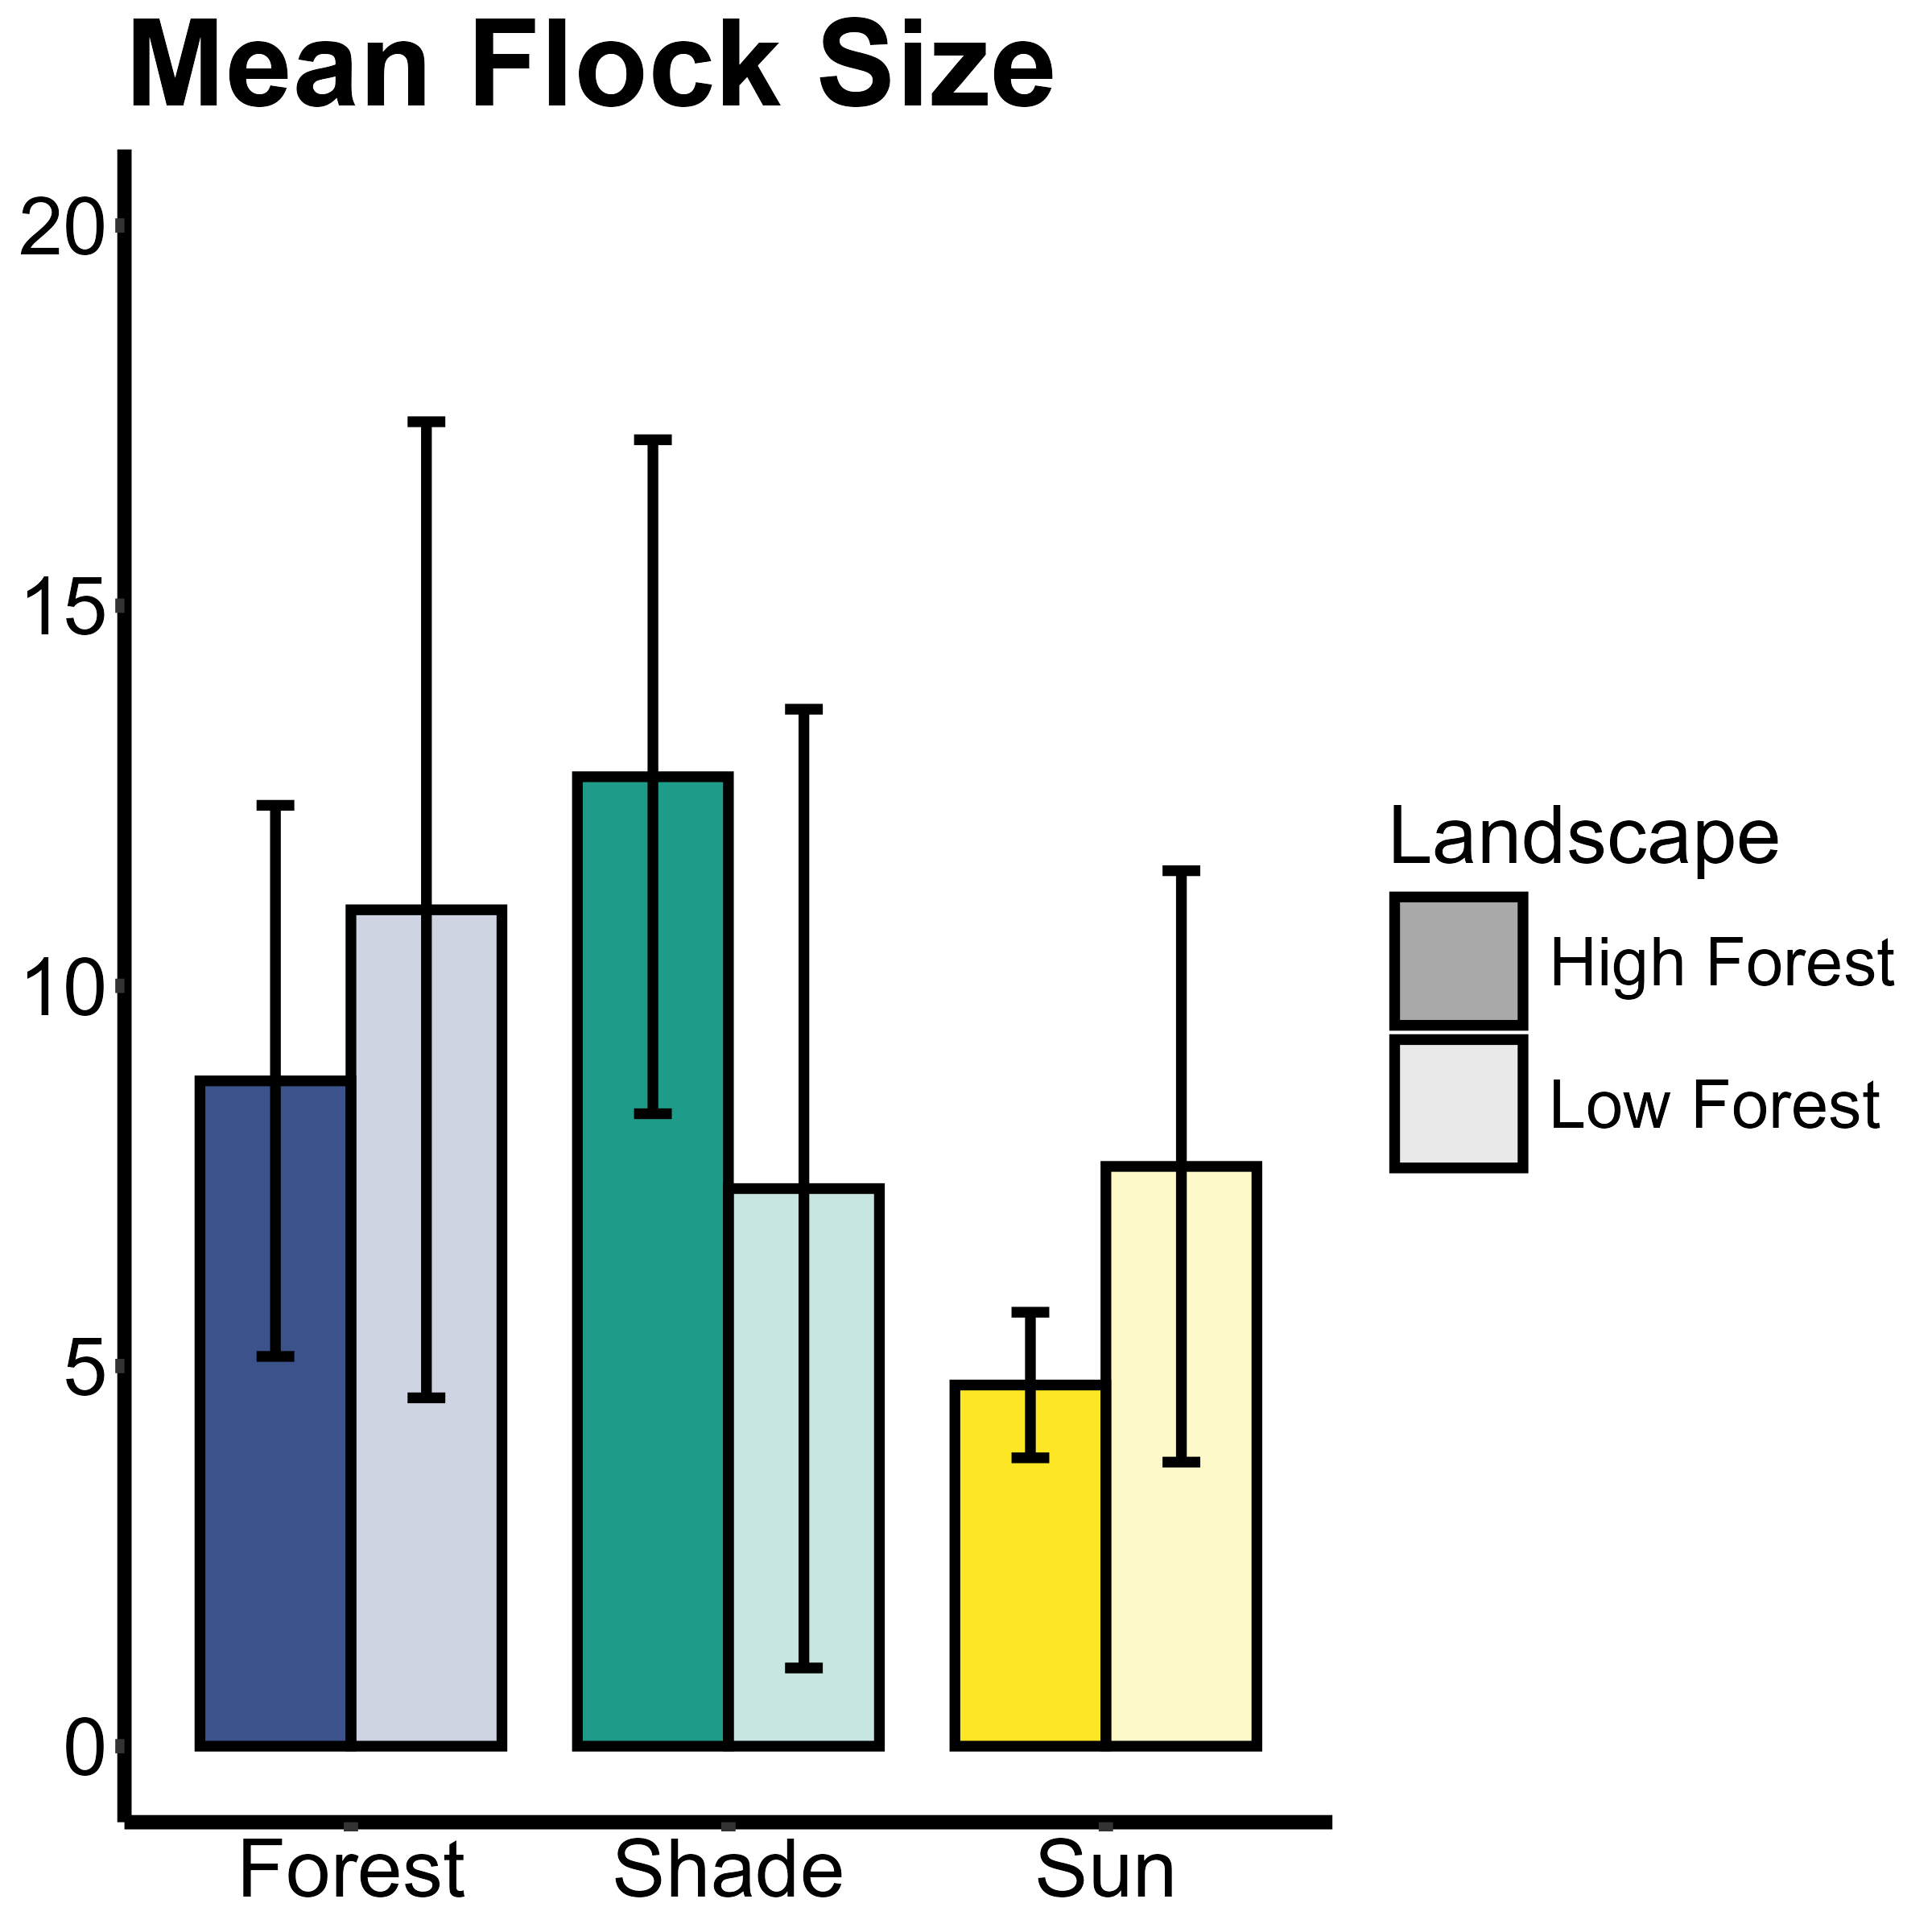
During all transects, in addition to determining the species and counts of all birds encountered, we tracked whether those birds we participating in flocks and if yes, the flock identity. We collected these data to determine if the the propensity of birds to participate mixed-species flocks may vary across the landscape.
We found that variation in mixed species flocks was not explained by
local land use or landscape. The
encounter rates, size, richness,
and proportions of migrants vs. residents in mixed species
flocks did not significantly differ among landscapes or with farm
practices.
We also examined the likelihood of the 3 most commonly encountered resident species and the 2 most commonly encountered migrant species to participate in mixed-species flocks across habitat types.
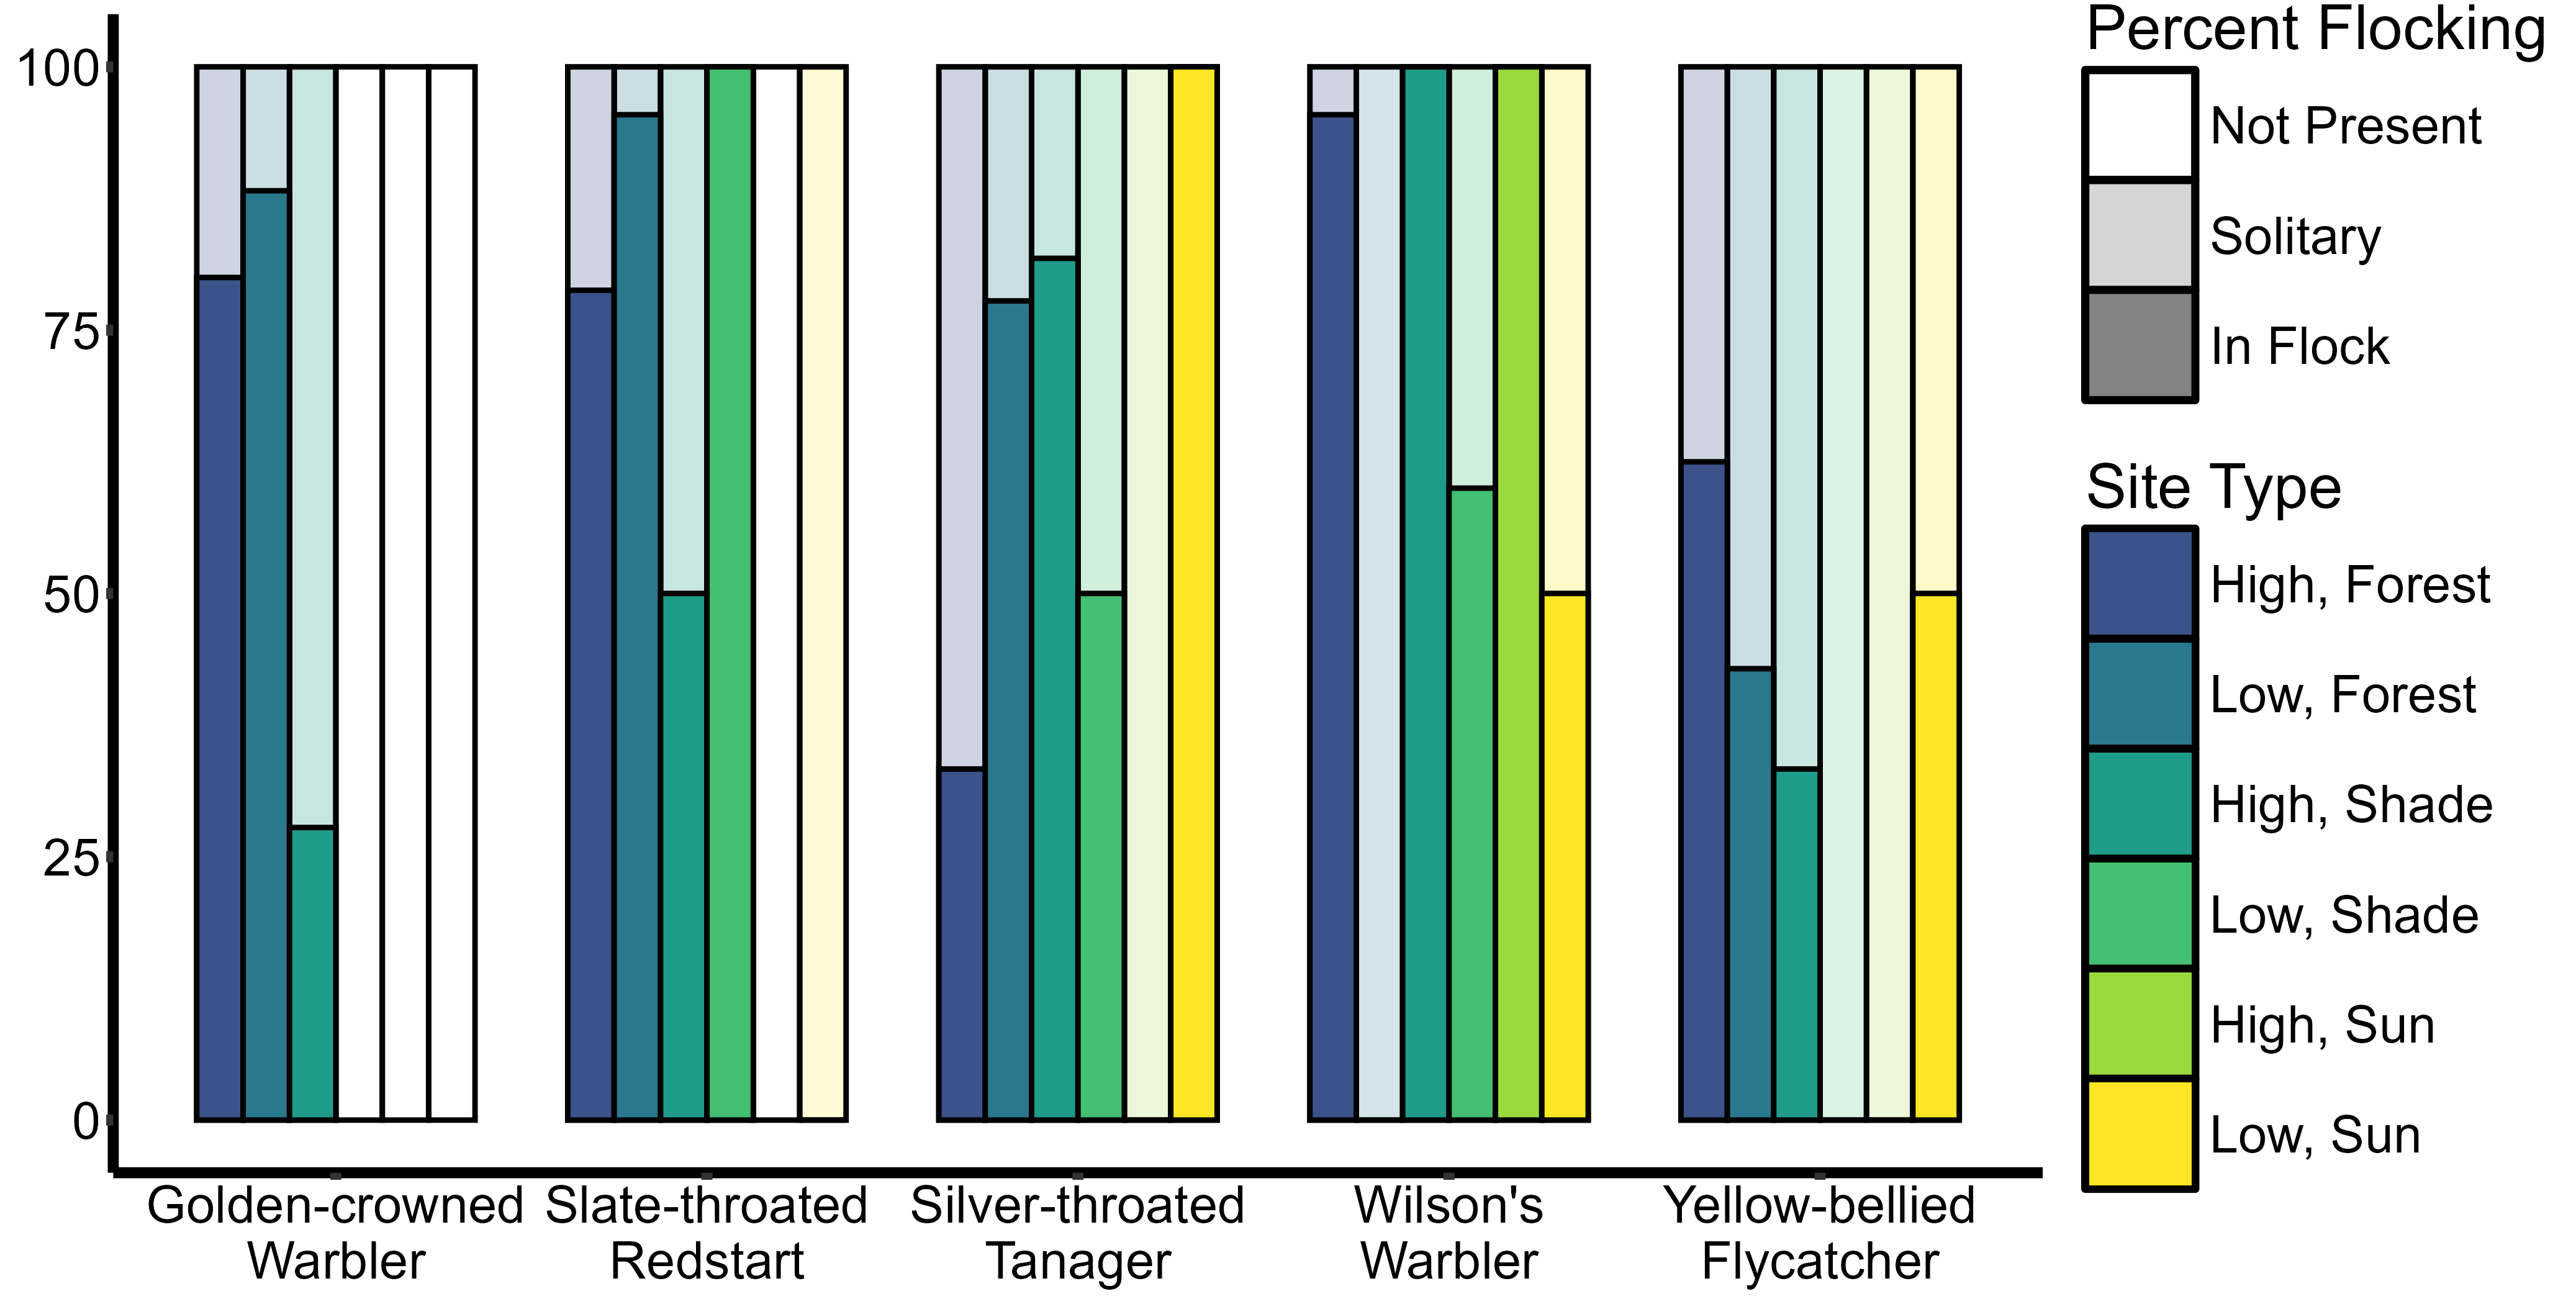
Farm and landscape features are related to flocking propensity of
resident species. Participation in mixed species flocks was
significantly related to coffee management for common resident species:
- Golden-crowned Warblers (p<0.001) -
Slate-throated Redstarts (p=0.09) -
Silver-throated Tanagers (p=0.005)
Silver-throated Tanagers participated most in flocks
when in landscapes with little forest cover (p=0.045).
Flock participation did not vary among the two most abundant migrants.
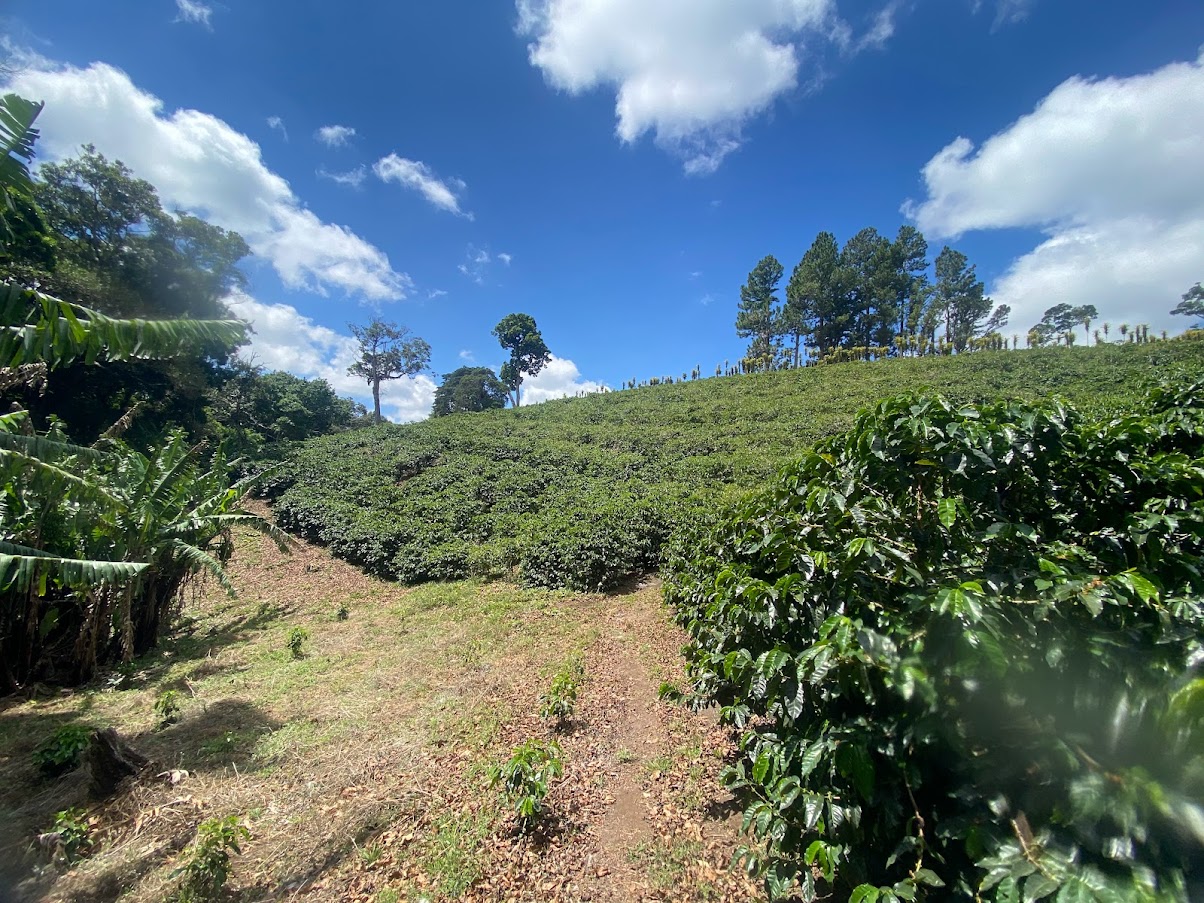
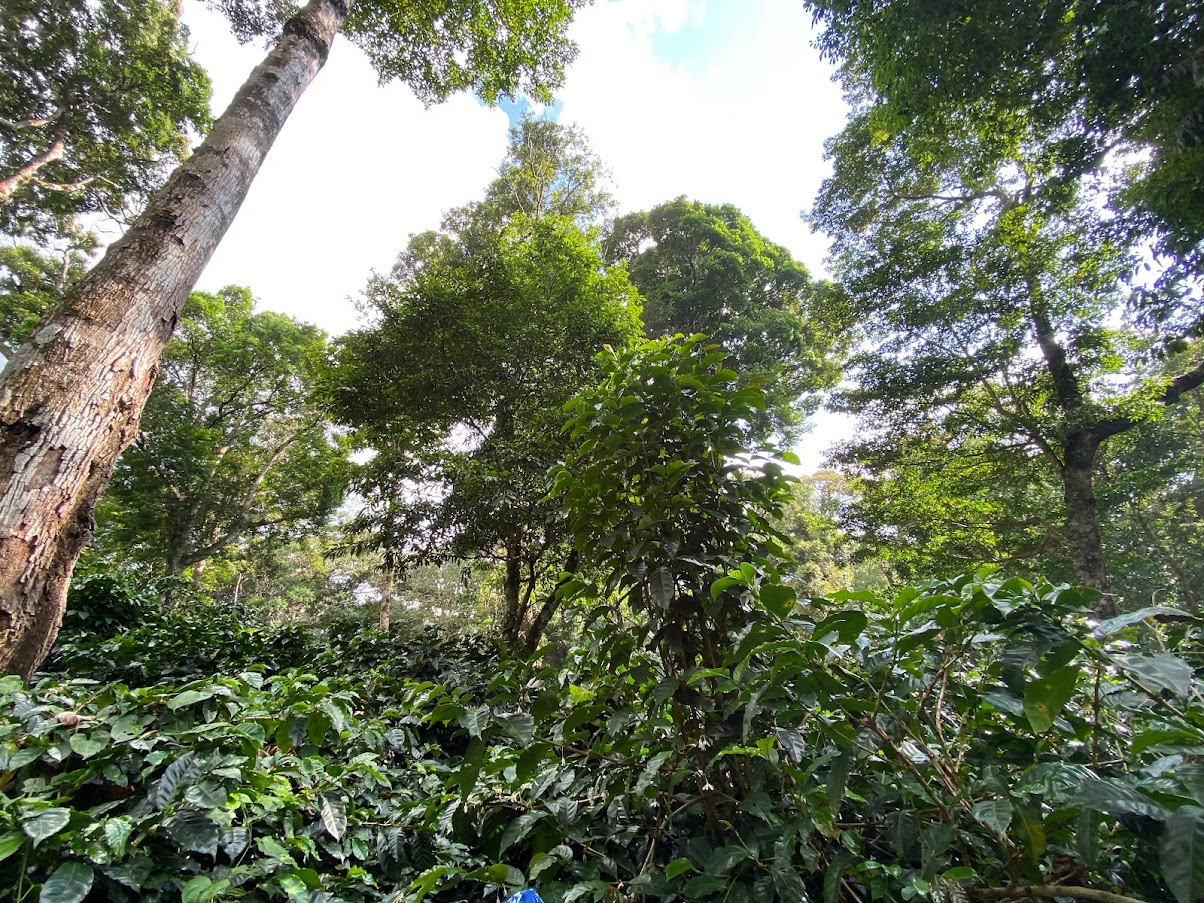
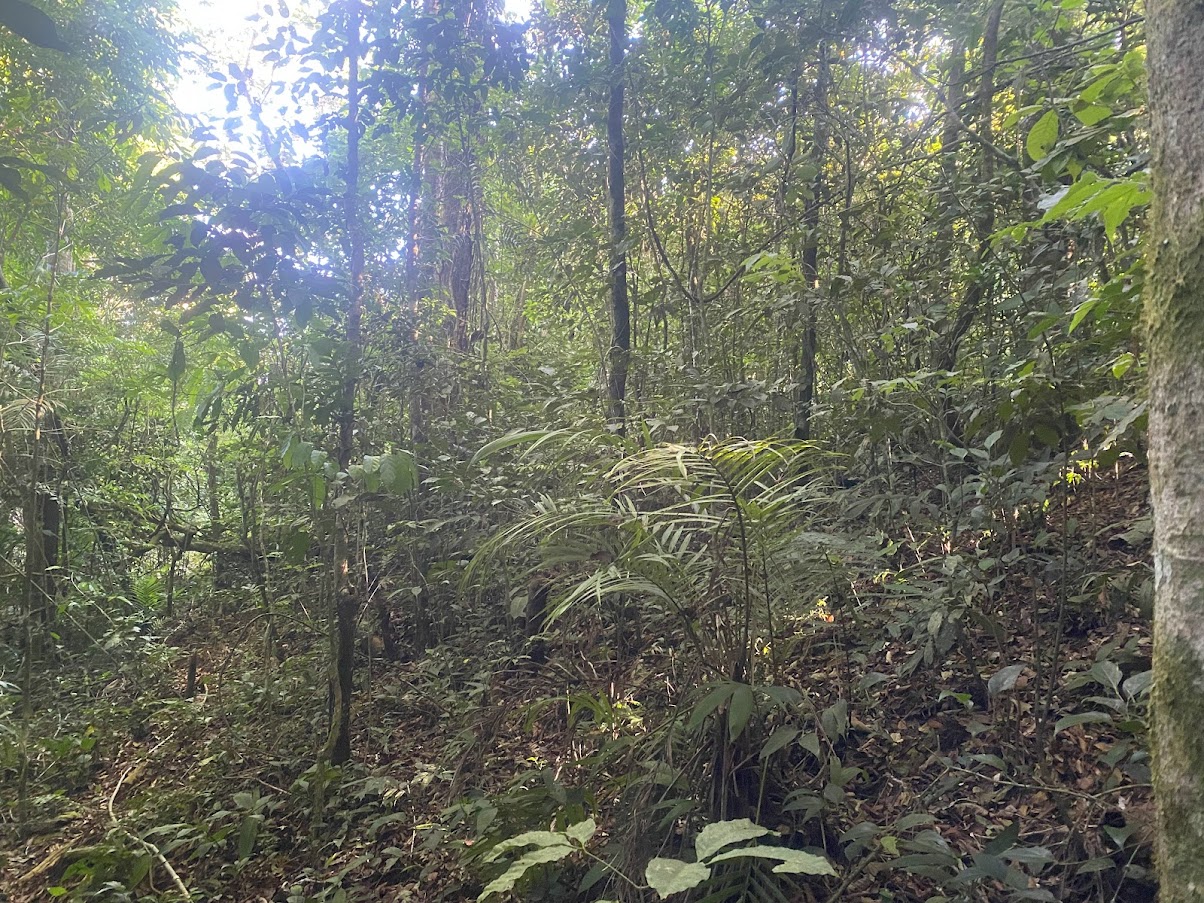
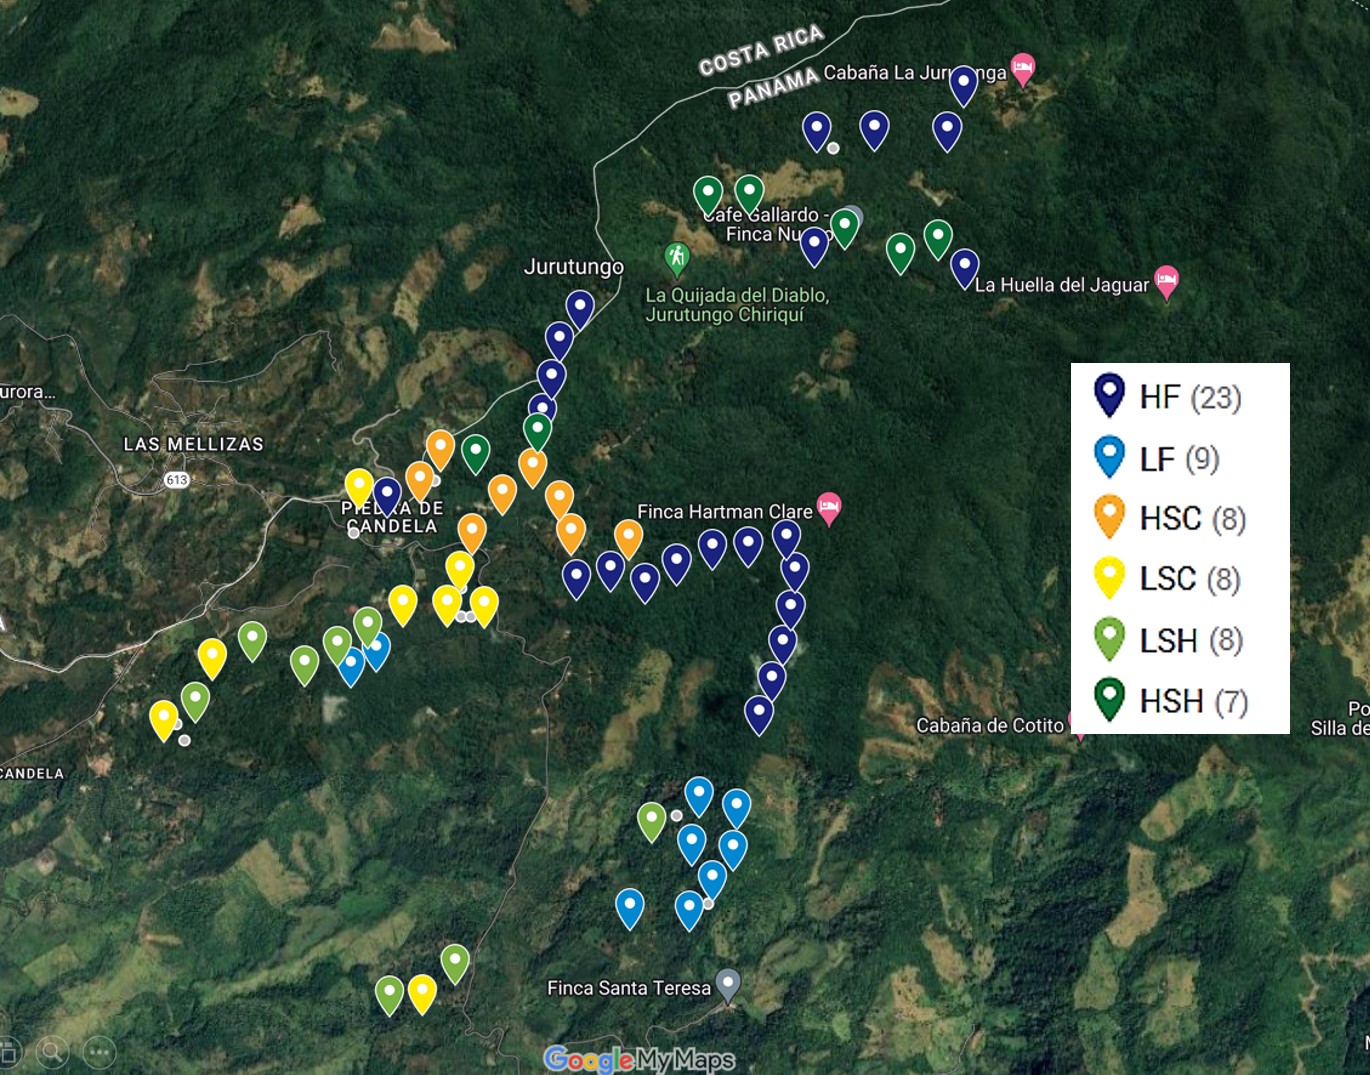
Site Photos
Here is the distribution of all sites in the landscape. The forest landcover is visible in this satellite image as the darkest green continuous vegetation.
Additionally, I wanted to show some typical images of the sun-coffee, shade-coffee, and forest plots. The following images were taken at field sites used in this study.